

Has the commercial real estate market in Central Texas stabilized since COVID?
I would argue it has based on the data trends over the last 6 years.
LEASING
Let’s start with vacancies and rental rates. For this article, we are focusing on the office space market. However, keep in mind that the retail and industrial markets have had some commonalities with the office market trends.
- Vacancy rates were averaging 7 ½% to 8% in the years leading up to COVID.
- Rental rates were trending upwards at an average of 5.5% annually.
- Landlords were not offering significant concessions (like free rent or large tenant improvement allowances).
- Subleasing represented 12% of the total availability of office space (which was in line with historical numbers).
When COVID hit, it didn’t simply create a temporary work from home period. It caused a structural change in how companies think about office space. This caused a trend towards more office attendance, but the evidence suggests that most companies are not returning to a 5 day, pre-2020 model. COVID broke the model of calculating space based on each employees need to occupy space.
Hybrid work became common place. Multiple studies have found that many companies have gone to office-based workdays from Tuesday-Thursday with Mon and FRI being flex days.
This is one reason office buildings have taken much longer to recover than employment itself. A company can have the same or even more employees it had in 2019 while now occupying less space.
While companies are reducing their total square feet, they can (and are), spending more per square feet for higher quality space to increase employee recruitment, retention and collaboration. This favors newer, Class A buildings loaded with amenities such as gyms/work out facilities, tenant lounges, good parking, natural lights and common collaborative spaces.
Right after the COVID shutdown vacancies started climbing . In the first year after the shutdown, vacancy rates shot up 50% to an average of 12%.
Then, the leasing market took a pause in 2021 as vacancies held steady.
What happened next is what the Tower Commercial experts predicted would happen. Many companies initially maintained their existing leases because they could not immediately be terminated. But then, as leases expired, companies began reducing their footprint. Then, another significant jump in vacancy occurred in 2022 as more companies had expiring leases and shed excess office space.
Today, vacancy rates have leveled off at 16%. Note that since 2021 the average asking rents have NOT gone down… and in fact are starting to go back UP as vacancy rates are now starting to come down, ever so slightly.
SUBLEASING
The sublease space inventory has fluctuated significantly since 2020. Here’s why: the Immediate impact of COVID was that some companies wanted to reduce their financial burden on space they didn’t need anymore BUT because they had lease obligations, the only option was to attempt to sublease their space. So, sublease inventory jumped to 18% of the total available of space up from only 9% of the total available space pre-COVID. Then the sublease inventory took a dive in 2021 as some companies’ leases were expiring allowing them to finally shed unwanted space. This shifted the obligation of having vacant space from the Tenant to the landlord. There was another significant jump in Sublease space inventory in 2022 as even more companies had leases expiring allowing them to “right size”. Since then, sublease space is slowly being absorbed and is now down to pre-covid levels of around 12% of the total available space. Worth noting: the total available space is just under 16% and dropping as it appears the overall market is stabilizing.
SALES/ACQUISITIONS
Sales prices for office buildings in the years leading up to COVID were trending upwards with average sales prices ranging from $300 to $350/ft.
The market continued to go up until the first quarter of 2022 then started to come down. This matches up with the fact that tenants started to shed excess space, which increased vacancy, which caused sellers to have to lower their prices if they wanted to sell their properties.
BUYING OPPORTUNITY
A phenomenon is happening now, which can best be described as a perfect storm for commercial real estate investors or owner occupants. That perfect storm would be that some Class B, 15- to-20 year old buildings that are in good condition and are even well located that have higher than average vacancies of 40% to 50% are now trading for $125/ft to $140/ft! Prior to COVID and the “right-sizing” effect of tenants, this Class of building was trading in the $250/ft. to $315/ft. range.
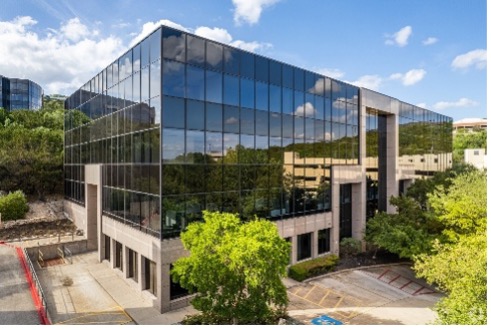
Bridgepoint Parkway
Photo courtesy of Costar
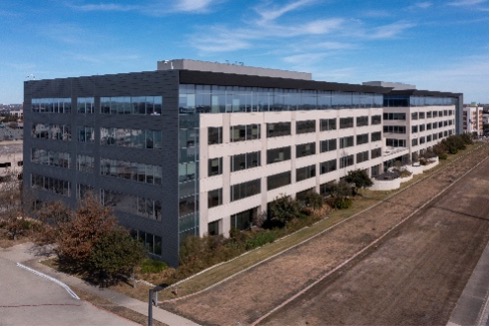
Emerson Control
Photo courtesy of Costar
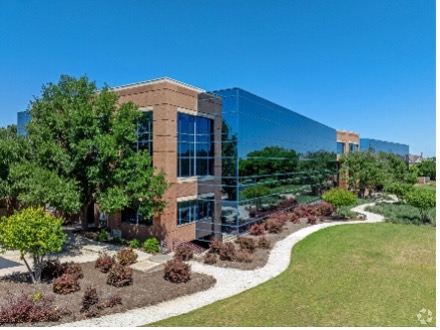
Quarry Lake II
Photo courtesy of Costar
CBD BUILDINGS
Prime downtown Austin Class A office buildings remain the exception, however, and continue to command premium valuations because demand remains strong for technology companies and other employers seeking a downtown presence.
Several examples are 111 Congress that traded in July for approx. $400/ft. and 601 W 2nd (Google Building) that traded about a 1 ½ years ago for $651/ft.
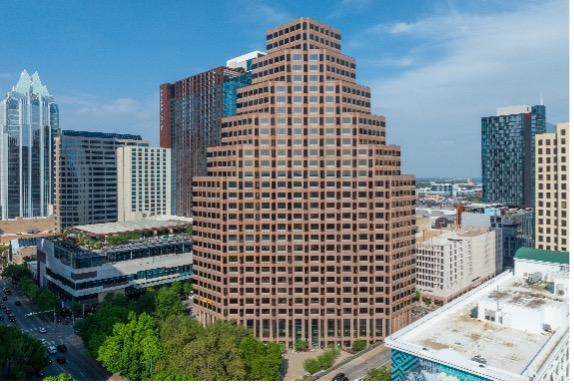
111 Congress
Photo courtesy of Costar
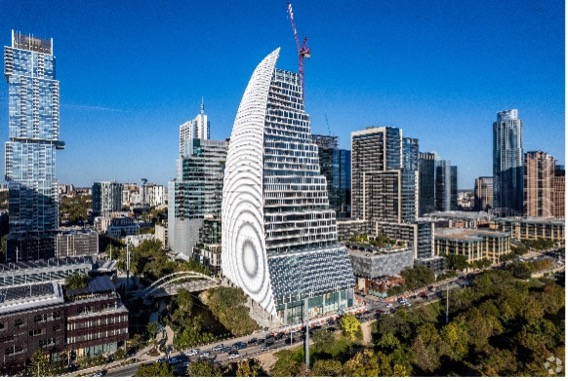
601 W 2nd Street
Photo courtesy of Costar
It’s a little bit of a different story with smaller commercial properties. Many sellers are attempting to hold the line on pre-covid valuations while buyers remain uninterested. We are seeing deals get done below the $3M range when either the seller finally HAS to sell for some reason or a buyer comes along that WANTS a particular property that fits their needs.
CAP RATEs
Cap Rate or Capitalization Rate is a % used to estimate the yearly return on an investment property. (It’s the NOI divided by the purchase price). This is used primarily by investors as opposed to owner occupants, but we still advise owner occupants to use cap rates as a guide.
Cap rates are very sensitive to “risk”. Risk can be things like increased vacancies, uncertainty in the economy, quality of the tenants, quality of location, etc.
Investor perception of commercial real estate prior to COVID was very good…relatively low risk so investors were willing to purchase property with the expectation of lower returns.
But AFTER COVID that changed. Investors perceived, and actually saw that commercial real estate got riskier since tenants were not needing as much space as they use to. That meant higher vacancy rates and thus less revenue for the investor. And sellers were having to sell for lower prices, which now means higher cap rates for the investor.
You can see in the graph that cap rates are starting to decline. That is because of the stabilization of the leasing market. For the investor, that means we will start to see upward pressure on pricing.
What will the next chapter of commercial real estate in Central Texas look like? Who knows. A lot will depend on the economy and how its affected by interest rates and the international scene. Now, we are confident to say it’s still a good time to be a buyer or tenant. Opportunities abound.
For more information about these topics or to learn more about commercial real estate in Central Texas, you can reach me at512-736-5933 or email me at oddo@toweratx.com.
Until next time,
Chris Oddo
Recent Comments